How to Make the Most of Google’s PageSpeed Insights Tool
You know users and search engines both prefer fast sites, but you may be wondering how you know if your website is performing compared to site speed standards.
You’re in luck — Google has a great free tool called PageSpeed Insights that allows you test pages on your site for speed. This tool reports on the performance of your pages for both mobile and desktop devices then provides you with recommendations on how to improve it. Even better is that all of their recommendations are in line with their pagespeed rules, which give you low-hanging fruit to tackle on your site.
Here’s how you make the most of Google PageSpeed Insights!
Page-by-Page Basis
One of the first things you should know is that PageSpeed Insights tests on a page level. In other words, one test applies only to that exact page and not the entire domain or URL sub-directory.
Real-World Data
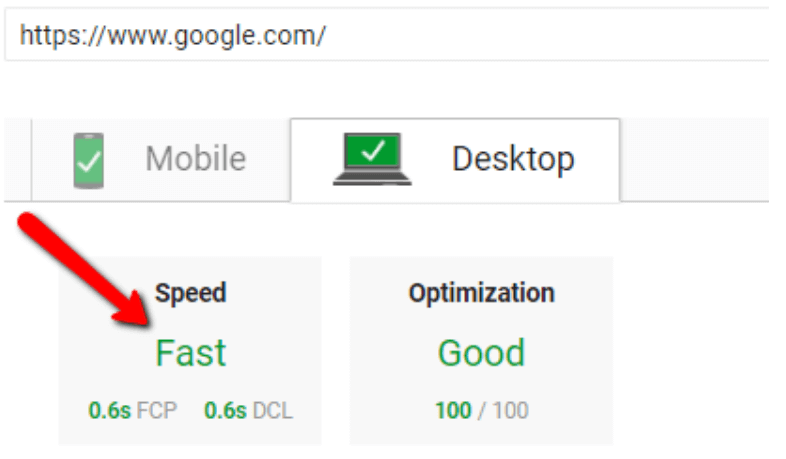
That’s right, ladies and gents! As of January 2018, Google announced their refactored PageSpeed Insights will provide you with real-world data that comes from the Chrome User Experience (CrUX) report. This data shows up under the “Speed” section of the tool:
Let me translate:
- FCP = First Contentful Paint, which is the point when the browser renders the first bit of content from the DOM (text, image, SVG, etc.)
- DCL = DOM Content Loaded, which marks the point when there are no other resources blocking the JavaScript execution. This means Googlebot can start to render the page
What does my speed score mean?
This first section of the report — screenshot above — shows you real-world performance data about your page.
Using the CrUX dataset, Google assigns median values to compare your site to all others, and then tells you if your page is “fast” (in the fastest third of all pages), “average” (middle third), or “slow” (bottom third).
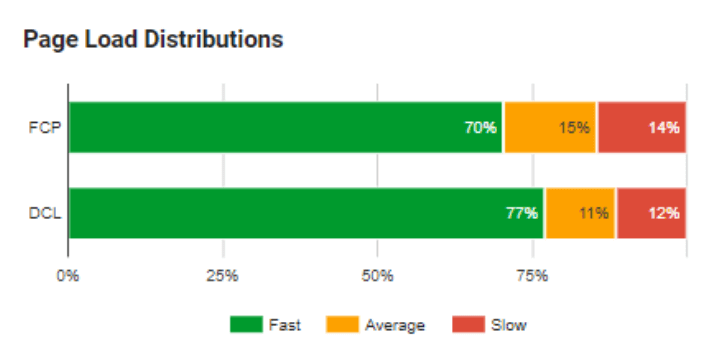
The Page Load Distribution chart shows you the distribution of the page’s FCP and DCL metrics in the CrUX dataset.
The Page Stats section provides you with data points on the number of “trips” that are required for Googlebot to load render-blocking resources, total bytes used by the page, and how it compares to other sites. This data (in conjunction with the optimization suggestions – see below) can be used to help decide if you can make your website faster by updating or upgrading the appearance of your page.
What are all the “Optimization Suggestions”?
The final section of the PageSpeed Insights tool is perhaps the most important. The suggestions are simply a list of Google’s best practices that could be applied to your webpage to make your page/site faster. In all the Analytics work and audits we do at Volume Nine, perhaps the most common culprits of slow pages we see are bulky, uncompressed images, browser caching, and poorly-designed scripts/coding.
While getting the real-world data and speeds is super convenient and useful, the optimization suggestions provided are going to be your “action items,” or next steps for making your website faster.
If you’re wondering if you need to make these optimizations for every single page, the answer is probably not. The great thing about the majority of suggestions provided by Google is that if you take these to your web development or IT team and they start to tackle the issues, you will see these things change and improve sitewide (if they’re addressed properly).
The suggestions are broken up into two sections: the first is “Optimization Suggestions” — this is where you will gather all your action steps towards a faster page and site. The second section is “Optimizations Already Present” — this is where you can pat yourself on the back for doing something where you got a thumbs up from Googlebot.
Each of the optimization suggestions based on Google’s rules will come with a “see how to fix” dropdown which tells you how to tackle the issue. This list of best practices is below, and we tell you (quickly) why you should care about each.
- Enable compression — This element and the one directly below are, perhaps, the two most common ones we see for our clients. Compressing resources (scripts, images, etc.) using gzip or another tool can reduce the number of bytes sent over your network, allowing the page will load faster.
- Optimize images — When images are compressed and properly formatted or optimized, you can save many bytes of data. Just be sure to optimize and reduce without compromising image quality.
- Improve server response time — This element measures how long it takes your server to load the HTML on the page being tested and begin rendering your page.
-
Leverage browser caching — Taking advantage of browser caching can save time for downloading resources on your site and serving the page to users.
-
Avoid landing page redirects — Redirects cause addition response time, so Google checks that you do not have a chain of redirects.
-
Minify resources — Minification applies to HTML, CSS, and JavaScript. Google will tell you where you should remove unnecessary or repetitive data/scripts without affecting the page rendering.
-
Optimize CSS Delivery — This is triggered when a page has render-blocking stylesheets (CSS) that delay the time it takes Googlebot to render your page.
-
Prioritize visible content — When Googlebot is attempting to render content above the fold and is required to take extra trips on your network, this rule gets flagged.
-
Remove render-blocking JavaScript — When the HTML for your page uses or references a blocking JavaScript file above-the-fold, this will go off. These types of JavaScript should be avoided or minimized.
Pro tip: The Page Speed Insights is great for desktop and mobile tests, but Google has an updated mobile speed testing tool called Test My Site. Use this for mobile deep dives.
There is almost always room for improvement on every site or page. Once you acknowledge these underlying issues and start to work your way through them, your site will become faster, and Google will love you for it.
Conclusion
As the saying goes: Less is more! Page speed is a critical ranking factor for your website and essential to good user experience, especially your mobile users.
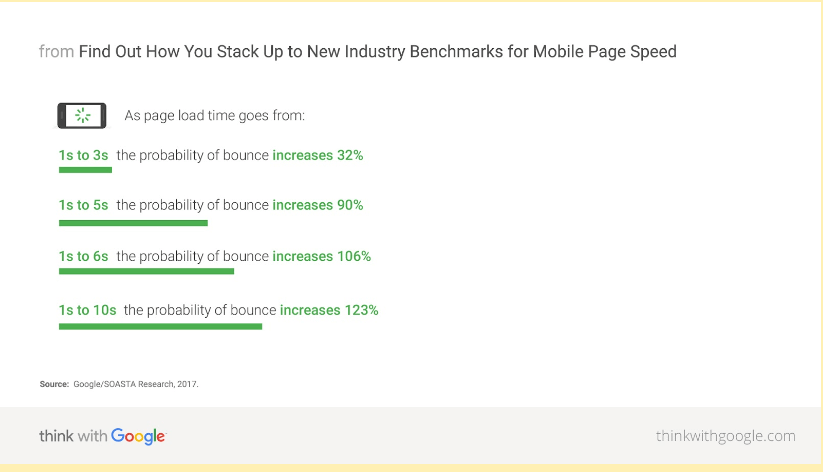
The stats above get even worse for mobile users. If a page takes longer than 3 seconds, users will most likely bounce.
With Google’s awesome, free PageSpeed Insights tool, you no longer need to worry about how your pages and your site are performing. With this handy blog, you can decipher what the test means to make the most of the findings. If you’re still confused after reading this blog post, reach out to the Analytics team at Volume Nine – we’re here to help!


